Natural Gas: Production Trends, Pricing Insights & Climate Impact

Natural gas Sourcing
Natural gas is the cleanest fossil fuel on the planet, and it is colourless and odourless in its natural state. It has four hydrocarbon atoms and one carbon atom (CH4 or methane).
Directional wells and hydraulic fracturing methods, particularly in shale, sandstone, limestone, and other constrained geologic formations, are responsible for most production increases since 2005. Natural gas is produced from coal beds, onshore and offshore oil and gas wells, and natural gas wells. About 13% more dry natural gas was produced in the US than was consumed there overall in 2021.
Currently, the majority of the natural gas utilised in the United States comes from that country. The amount of dry natural gas produced in the United States in 2021 was around 34.5 trillion cubic feet, the largest yearly output volume ever recorded (average: 94.6 billion Tcf/day).
The United States produced 1 Tcf more dry natural gas in 2021 than it did in 2020 as even the natural gas extraction industry emerged from the COVID-19 pandemic's effects and was bolstered by rising export demand and natural gas pricing. About 70% of the dry natural gas produced in the United States in 2021 came from five of the 34 states that produce it.
Natural Gas Supply-Chain
Numerous factors can affect the availability of natural gas. The possibility of either an accident or tragedy due to weather is an unpredictable issue. The manufacturing will be reduced in such a case, which will have an impact on the pricing.
The ability of supply to satisfy demand will depend on the accessibility of the necessary infrastructure. The infrastructure that transmits this commodity must be able to accommodate the increased traffic that comes with a rise in demand. When it seems that this need will never go away, additional infrastructure might be constructed. The cost will remain high till the job is finished since it will take some time.
The total supply of natural gas may be affected by the export and import of gas between nations. The gas-exporting nation may take action by reducing the supply in the event of political turmoil between the two nations. Not only will this have an impact on the adjacent nation but also on other nations whose supply lines pass through it. Natural gas must always be transported through the nation's pipelines, unlike many other commodities. As a result, an importer depends not only on the manufacturer but also on the other nations that own the pipelines.
The upstream, middle, and downstream components of the US natural gas supply chain are all interconnected. Drilling and production are included in the upstream; treatment and transportation are included in the midstream; and industrial, residential, and commercial usage are included in the downstream.
Price Prediction
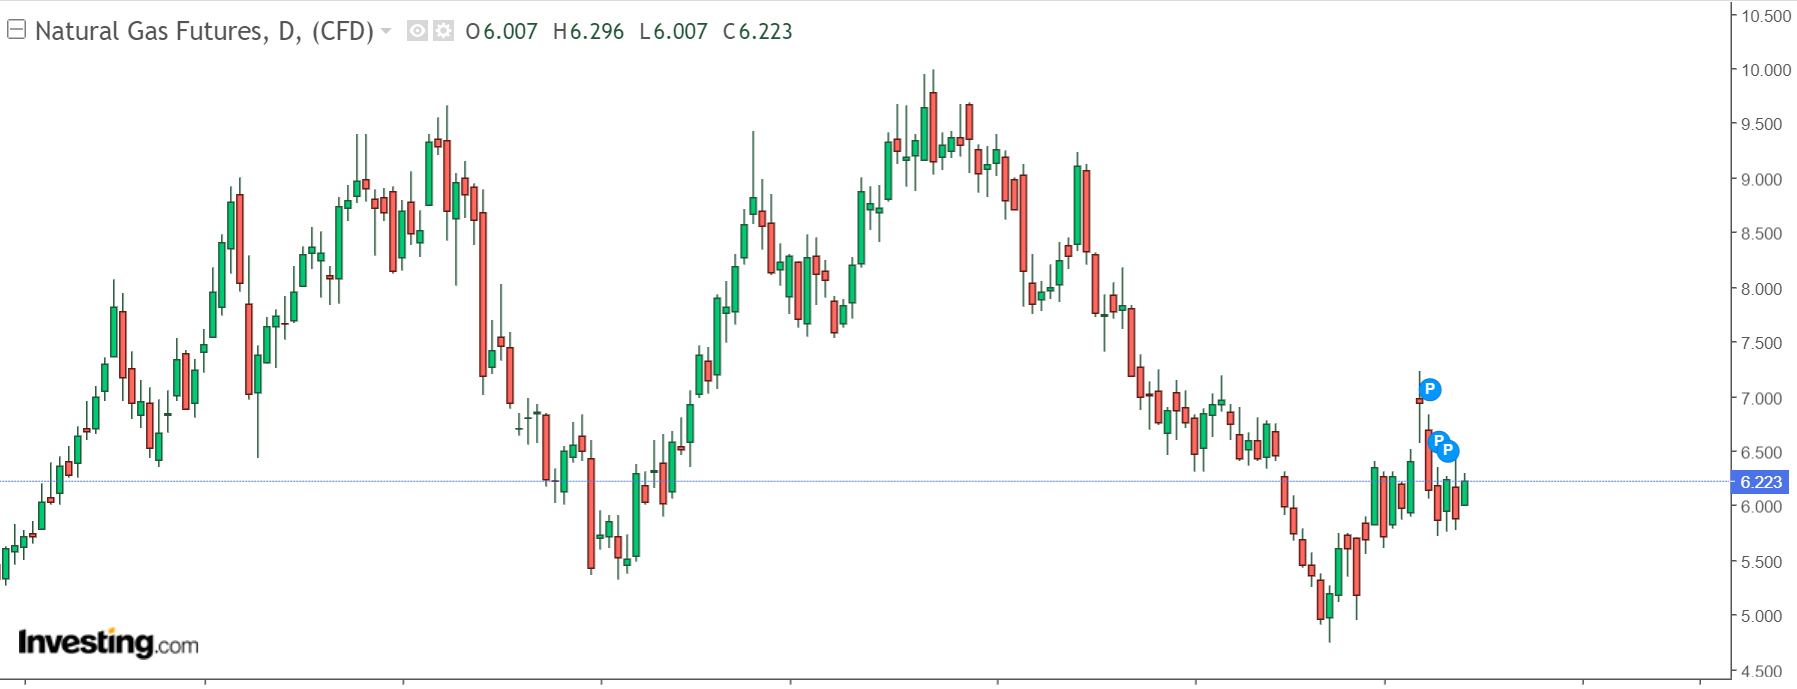
After a very tumultuous trading week, U.S. natural gas prices increased by roughly 7% to a 3-week high early Friday due to projections for significantly colder weather and more heating demand around mid-November than initially anticipated.
According to analysts at energy consultancy firm Gelber & Associates, the market was centred "on the expected arrival of broad below-average weather from across the U.S. around mid-November which will raise demand for gas as a heating fuel."
Gas prices in the Northeast of the United States fell on Friday due to warm temperatures and low heating demand, only with Eastern Gas Southern hub in Pennsylvania, New York City, as well as the Algonquin hub in England all experiencing their lowest rates since November 2020.
Gas futures have gained nearly 72% overall this year to date as higher gas prices around the world fuel demand for American exports as a result of supply shocks and sanctions related to Russia's war on Ukraine. Gas was selling for $29 per MMBtu at the Japan Korea Marker (JKM) in Asia and $35 per MMBtu just at Dutch Title Transfer Facility (TTF) in Europe.
Since the United States is the world's largest LNG producer and has all the fuel it requires for domestic consumption, while capacity restrictions and the Freeport outage have stopped the nation from exporting more LNG, U.S. gas futures prices lag well behind worldwide prices.
According to data source Refinitiv, the average gas production in the Lower 48 States of the United States has decreased to 98.1 bcfd thus far in November from a record-breaking 99.4 bcfd in Oct. However, traders observed that output statistics from the beginning of the month were typically adjusted upward later on in the month.
Refinitiv predicted that the average U.S. natural gas production, including exports, would increase from 97.6 bcfd to 100.1 bcfd in a week and 119.0 bcfd within 2 weeks as a result of the impending arrival of seasonably cooler weather. Refinitiv's Thursday outlook was lower than the forecast for the following week.
In November, the average volume of gas going to U.S. LNG-promoting exports increased from 11.4 bcfd to 11.3 bcfd in Oct.
Due primarily to the ongoing Freeport outage, that figure is still significantly below the monthly average of 12.9 bcfd set in March. Around 13.8 bcfd of energy may be converted into LNG at the seven large U.S. export facilities.
Natural Gas Storage
Stocks of natural gas are crucial in determining prices. When inventories are below the five-year average, natural gas prices are frequently higher; when inventories are above the five-year average, natural gas prices are frequently lower. This winter, we anticipate a 2,110 Bcf drain from natural gas reserves, which is in line with the seasonal average for the previous five years. At the end of March, we anticipate that natural gas stockpiles will amount to 1,433 Bcf, which is 8% less than the five-year average. The actual inventory results, however, will be greatly influenced by the winter temperatures that are experienced.
Production Forecast
The amount of natural gas produced has been rising gradually throughout 2022, and according to our prediction for November, dried natural gas production will average 100.4 billion cubic feet each day (Bcf/d). Due to the potential for harsh weather that could result in production shutdowns, we anticipate a decrease in natural gas output over the winter. Moreover, natural gas costs for the remainder of the forecast period continue to be less expensive than those in 2Q22 and 3Q22. We predict that drilling activity will decline in 2023 and that production of natural gas will average 99.7 Bcf/d, 2% more than in 2022 but less than the current monthly mean production because of reduced prices and some capacity limitations in the pipelines used to transport natural gas from areas of manufacturing to consumer markets.
Production of natural gas offshore
Some wells are dug into the ocean bottom in the waters of the United States coast, despite the fact that the majority of oil and natural gas wells in the country are on land. About 0.8 Tcf worth of dry natural gas will be produced offshore in total in 2021, and 88% of that came from government waterways inside the Gulf of Mexico About 0.7 Tcf, or 2% of the nation's maximum dry natural gas production, came from government Gulf of Mexico production. In 2021, the amount of dry natural gas produced offshore in the United States from ocean waters managed by Alabama, Alaskan, Californian, Louisiana, and Texas amounted to around 0.3% of the nation's total production.
Climate and Natural Gas
Weather variations have a significant impact on gas demand and price. The biggest cause of gas price volatility is variations in weather patterns. Gas prices exhibit a distinct seasonal pattern as well, with prices rising in the fall and winter due to an increase in demand for heating. Additionally, prices decline in the spring and early summer as demand declines.
The requirement for natural gas is influenced by a number of factors. The demand is affected by the weather because it is frequently used to produce heat. As a result, demand will rise during colder weather.
The fuel for power plants that generate electricity is more frequently natural gas. The more stable pricing of natural gas as well as the popularity of natural gas as a clean fuel source can be used to explain this rise in consumption.
Customers now have a choice in their supplier, thanks to the liberalisation of the natural gas industry. Because people shop around for the greatest deals, this has an impact on the cost.
A quick rise or fall in demand may have little impact on the price because of the storage space because it is simple to store. Natural gas can be kept for cooler seasons while also taking the weather's influence during high temperatures into consideration.